


In this tutorial, we'll see several examples of similarity matrix in Python:
- Cosine similarity matrix
- Pearson correlation coefficient
- Euclidean distance
- Jaccard similarity
- difflib sequence matcher
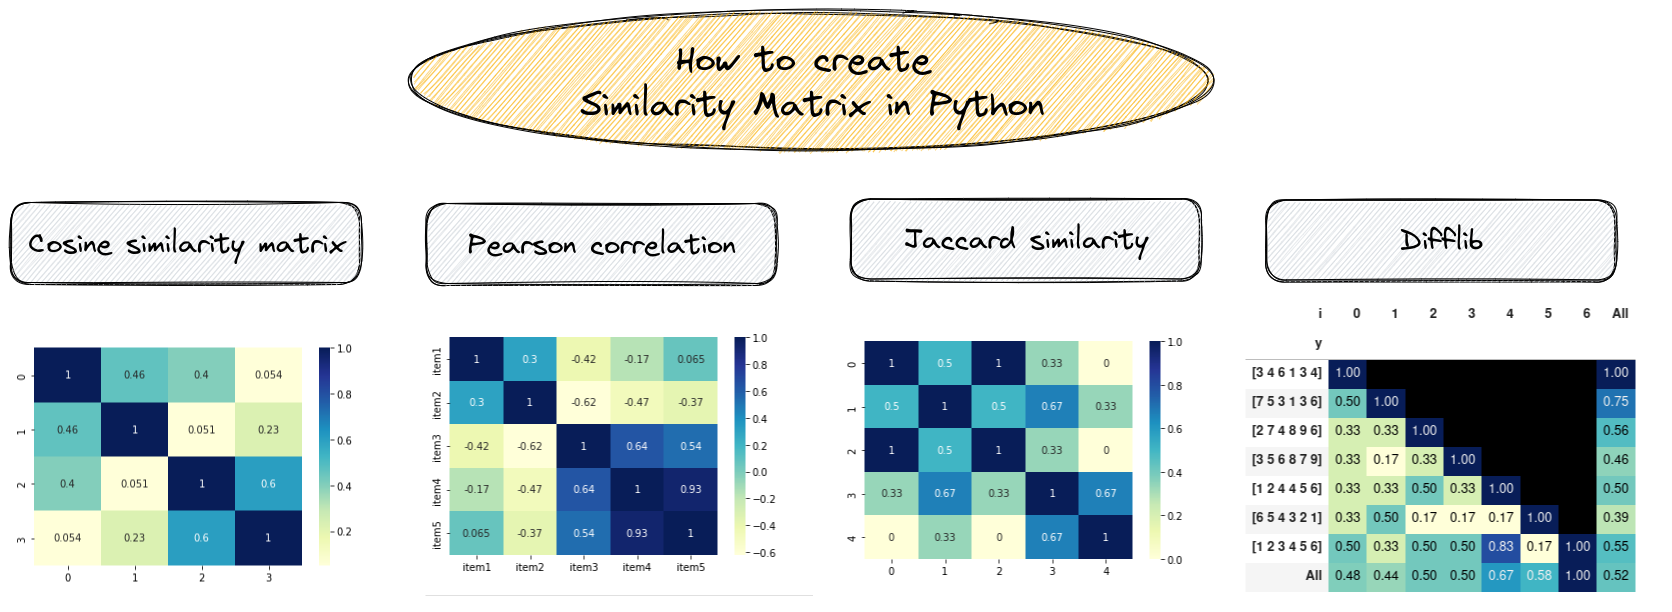
And finally we will show how to visualize them.
Cosine similarity
Cosine similarity measures the cosine of the angle between two non-zero vectors in a high-dimensional space. It is often used in natural language processing to compare documents or words based on their term frequency or Term frequency–inverse document frequency (TF-IDF) values.
TF-IDF, is a numerical statistic that is intended to reflect how important a word is to a document in a collection or corpus.
To build cosine similarity matrix in Python we can use:
- collect a list of documents
- create a TfidfVectorizer object
- compute the document-term matrix
- compute the cosine similarity matrix
from sklearn.metrics.pairwise import cosine_similarity
from sklearn.feature_extraction.text import TfidfVectorizer

documents = [
	"The quick brown fox jumps over the lazy dog",
	"A quick brown dog outpaces a quick fox",
	"The slow grey cat watches the fast dog",
	"A slow grey dog outpaces a fast cat",
]

vectorizer = TfidfVectorizer()
doc_term_matrix = vectorizer.fit_transform(documents)

cosine_sim_matrix = cosine_similarity(doc_term_matrix)
print(cosine_sim_matrix)
The resulted cosine similarity matrix is shown below:
[[1.     	0.46466784 0.39981419 0.05364441]
[0.46466784 1.     	0.05067865 0.22611742]
[0.39981419 0.05067865 1.     	0.60042396]
[0.05364441 0.22611742 0.60042396 1.    	]]
Visualize similarity matrix
We can visualize the similarity matrix by using seaborn library:
import seaborn as sns
import matplotlib.pyplot as plt

sns.heatmap(cosine_sim_matrix, annot=True, cmap="YlGnBu")
plt.show()
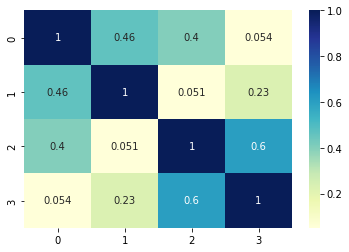
We can conclude that:
- items 0 and 1 have words in common
- items 2 and 3 have similarity
Euclidean distances
To compute euclidean distances of several numerical vectors we can use numpy.
The example below shows how to create similarity matrix based on euclidean distances:
- define a list of equally sized vectors
- compute the pairwise Euclidean distances
import numpy as np

vectors = np.array([
	[3, 4, 6, 1, 3, 4],
	[7, 5 ,3, 1, 3, 6],
	[2, 7, 4, 8, 9, 6],
	[3, 5, 6, 8, 7, 9]
])
euclidean_distances = np.sqrt(((vectors[:, np.newaxis] - vectors) ** 2).sum(axis=2))
print(euclidean_distances)
result:
[[ 0.      	5.47722558 10.14889157  9.53939201]
[ 5.47722558  0.     	10.72380529  9.94987437]
[10.14889157 10.72380529  0.      	4.69041576]
[ 9.53939201  9.94987437  4.69041576  0.    	]]
Difflib
We can build a custom similarity matrix using for and library difflib. We will use method: .SequenceMatcher(None,n,m).ratio() - to compute similarity between two numerical vectors in Python:
- loop over each list of numbers
- then loop the rest
- calculate the similarity of both lists
- store the similarity ratio
import difflib

vectors = np.array([
	[3, 4, 6, 1, 3, 4],
	[7, 5 ,3, 1, 3, 6],
	[2, 7, 4, 8, 9, 6],
	[3, 5, 6, 8, 7, 9],
	[1, 2, 4, 4, 5, 6],
	[6, 5, 4, 3, 2, 1],
	[1, 2, 3, 4, 5, 6,]
])

s = []
for i, n in enumerate(vectors):
	for m in vectors[i:]:
    	r = difflib.SequenceMatcher(None,n,m).ratio()
    	s.append({'x':n, 'y':m, 'r':r, 'i':i})
df_p = pd.DataFrame(s)
df_p[['x', 'y']] = df_p[['x', 'y']].astype(str)
df_p
result:
| x | y | r | i | |
|---|---|---|---|---|
| 0 | [3 4 6 1 3 4] | [3 4 6 1 3 4] | 1.000000 | 0 |
| 1 | [3 4 6 1 3 4] | [7 5 3 1 3 6] | 0.500000 | 0 |
| 2 | [3 4 6 1 3 4] | [2 7 4 8 9 6] | 0.333333 | 0 |
| 3 | [3 4 6 1 3 4] | [3 5 6 8 7 9] | 0.333333 | 0 |
| 4 | [3 4 6 1 3 4] | [1 2 4 4 5 6] | 0.333333 | 0 |
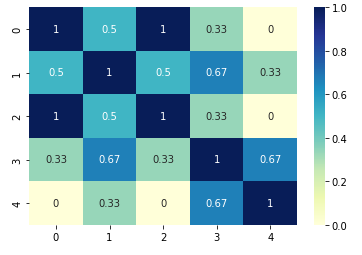
Now we can visualize the similarity ratio in matrix form by using Pandas pivot table and styling:
pd.pivot_table(df_p, index='y', columns='i', values='r', sort=False, margins=True)\
	.style.background_gradient(cmap='Greens',axis=None).format(na_rep='', precision=2)
the similarity ratio styled with colors:
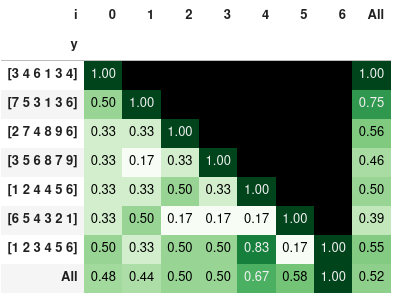
Note: the last 3 examples show that order is important. So you may sort the lists prior comparison - in case that you would like to compare only the elements and not the order.
Pearson correlation matrix
We can use Pandas library to calculate Pearson correlation coefficients in Python. We will use method: df.corr(method='pearson'):
import pandas as pd

data = {'item1': [3, 4, 6, 1, 3, 4],
    	'item2': [7, 5 ,3, 1, 3, 6],
    	'item3': [2, 7, 4, 8, 9, 6],
    	'item4': [3, 5, 6, 8, 7, 9],
    	'item5': [1, 2, 4, 4, 5, 6]}
df = pd.DataFrame(data)

corr_matrix = df.corr(method='pearson')

sns.heatmap(corr_matrix, annot=True, cmap="YlGnBu")
plt.show()
we can display the matrix with seaborn again:

To understand the results consider:
- coefficients range between -1 and 1
- -1 indicates a perfect negative linear correlation
- 0 indicates no linear correlation
- 1 indicates a perfect positive linear correlation
For example:
- [2, 3, 5] and [3, 5, 2] generates -0.42
- [2, 3, 5] and [3, 4, 6] generates 1
Jaccard similarity matrix
For Jaccard similarity we will use only binary values. The example below use library sklearn to calculate Jaccard score:
from sklearn.metrics import jaccard_score

data = [[0, 1, 0], [0, 1, 1], [0, 1, 0], [1, 1, 1], [1, 0, 1]]

similarity_matrix = []
for i in range(len(data)):
	row = []
	for j in range(len(data)):
    	row.append(jaccard_score(data[i], data[j]))
	similarity_matrix.append(row)

sns.heatmap(pd.DataFrame(similarity_matrix), annot=True, cmap="YlGnBu")
plt.show()
The result is shown below:
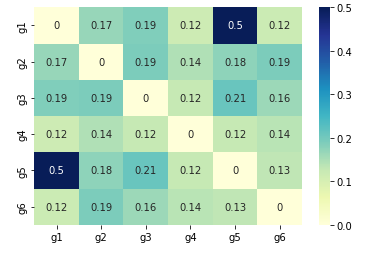
Inter element similarity
We can also check the similarity, correlation or distance between elements of arrays. We will show one example using scipy.
In this example we are comparing six variables: ["g1","g2","g3","g4","g5", "g6"]
import pandas as pd
from scipy.spatial.distance import euclidean, pdist, squareform


def similarity_func(u, v):
    return 1/(1+euclidean(u,v))

DF_var = pd.DataFrame.from_dict({"s1":[3, 4, 6, 1, 3, 4],"s2":[3, 5 ,3, 1, 3, 6],"s3":[3, 7, 4, 8, 3, 6],"s4":[3, 5, 6, 8, 4, 9]})
DF_var.index = ["g1","g2","g3","g4","g5", "g6"]

dists = pdist(DF_var, similarity_func)
DF_euclid = pd.DataFrame(squareform(dists), columns=DF_var.index, index=DF_var.index)
sns.heatmap(DF_euclid, annot=True, cmap="YlGnBu")
plt.show()
So we have strongest relatation between g1 and g5: