In this brief tutorial, we'll see how to display two and more DataFrames side by side in Jupyter Notebook.
To start let's create two example DataFrames:
import pandas as pd
df1 = pd.DataFrame({'lkey': ['foo', 'bar', 'baz'],
                    'value': [1, 2, 3]})

df2 = pd.DataFrame({'rkey': ['foo', 'bar', 'baz'],
                    'value': [5, 6, 7]})
df1:
| lkey | value | |
|---|---|---|
| 0 | foo | 1 |
| 1 | bar | 2 |
| 2 | baz | 3 |
df2:
| rkey | value | |
|---|---|---|
| 0 | foo | 5 |
| 1 | bar | 6 |
| 2 | baz | 7 |
Solution 1: Display two DataFrames side by side pure Pandas solution (with title)
The first option for rendering two DataFrames side by side is to change Pandas styling methods. This solution is available since Pandas 0.17. With this method you can set titles for your DataFrames.
First we will create Styler object with:
- use method set_table_attributes in order to set
"style='display:inline'" - add title for each DataFrame:
import pandas as pd
from IPython.display import display_html


df1_styler = df1.style.set_table_attributes("style='display:inline'").set_caption('df1')
df2_styler = df2.style.set_table_attributes("style='display:inline'").set_caption('df2')
df2_t_styler = df2.T.style.set_table_attributes("style='display:inline'").set_caption('df2_t')

display_html(df1_styler._repr_html_()+df2_styler._repr_html_(), raw=True)
display_html(df1_styler._repr_html_()+df2_styler._repr_html_() +df2_t_styler._repr_html_(), raw=True)
result:

If you like to add space between DataFrames you can use:
space = "\xa0" * 10
display_html(df1_styler._repr_html_()+ space  + df2_styler._repr_html_(), raw=True)
Solution 2: Render DataFrames side by side by CSS override - with index
The simplest solution is to change the CSS for the output cells - this will align the DataFrames next to each other . You need to change flex-direction:
from IPython.display import display, HTML

css = """
.output {
    flex-direction: row;
}
"""

HTML('<style>{}</style>'.format(css))
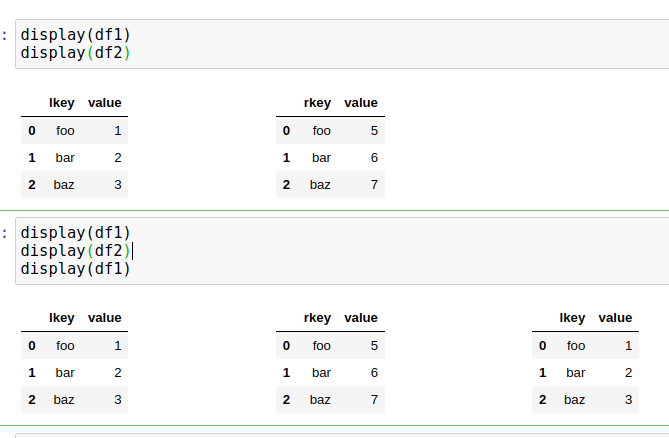
Then you can display two and more DataFrames side by side by:
display(df1)
display(df2)
display(df1)
Result:

Solution 3: Display two DataFrame by Pandas merge - without index
If data in both DataFrames is related you can use Pandas merge on one or more columns and combine them in one DataFrame. This can be done by next code:
df1.merge(df2, left_on='lkey', right_on='rkey', suffixes=('_df1', '_df2'))
result:
| lkey | value_df1 | rkey | value_df2 | |
|---|---|---|---|---|
| 0 | foo | 1 | foo | 5 |
| 1 | bar | 2 | bar | 6 |
| 2 | baz | 3 | baz | 7 |
Solution 4: Display two DataFrame by Pandas concat - without index
The final option is to use Pandas concat on both and display the output. Again this will work only on similar DataFrames:
pd.concat([d.reset_index(drop=True) for d in [df1, df2]], axis=1)
result:
| lkey | value | rkey | value | |
|---|---|---|---|---|
| 0 | foo | 1 | foo | 5 |
| 1 | bar | 2 | bar | 6 |
| 2 | baz | 3 | baz | 7 |


