


In this article you can find few examples about:** How do you get currency data in Python?**
Python currency libraries
Below you can find Python libraries for currency conversion: USD, EUR etc:
- quickforex
- Quick and easy access to foreign exchange rates. By default, this API uses exchangerate.host as backend.
- CurrencyConverter
- This is a currency converter that uses historical rates against a reference currency (Euro). It is compatible with Python3.6+.
- forex-python
- Forex Python is a Free Foreign exchange rates and currency conversion. Features: List all currency rates. BitCoin price for all curuncies. Converting amount to BitCoins.
Get Currency Data in Python on date
First example shows how to convert between multiple currencies on a given date:
from currency_converter import CurrencyConverter
c = CurrencyConverter()

from datetime import date
c.convert(100, 'EUR', 'USD', date=date(2013, 3, 21))
result:
129.1
Get Currency Data for range of dates
Let say that we would like to get information for multiple currencies and range of dates. We can use the following code to achieve that:
import pandas as pd
from forex_python.converter import CurrencyRates
c = CurrencyRates()

date_range = pd.period_range(start='2022-01-01', end='2023-12-31', freq='d')
date_range

df = pd.DataFrame({'DateTime': date_range})
df['Currency'] = "EUR-USD"

df['Rate_'] = df.apply(lambda x: c.get_rate(x['Currency'].split('-')[0].strip(), x['Currency'].split('-')[1].strip(), x['DateTime']), axis=1)
This will take as input:
- pair of currencies -
EUR-USD - date -
2022-01-01
The ouput will be the rate for the given input 1.1326:
| DateTime | Currency | Rate_ | |
|---|---|---|---|
| 0 | 2022-01-01 | EUR-USD | 1.1326 |
| 1 | 2022-01-02 | EUR-USD | 1.1326 |
| 2 | 2022-01-03 | EUR-USD | 1.1355 |
| 3 | 2022-01-04 | EUR-USD | 1.1279 |
| 4 | 2022-01-05 | EUR-USD | 1.1319 |
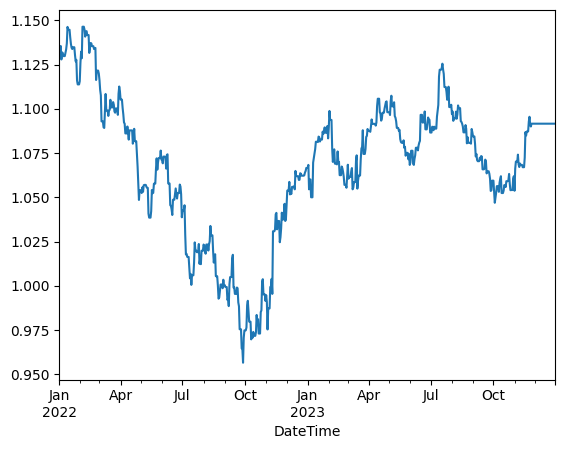
Plot Currency Data in Python
Finally we can see how to plot currency data in Python:
df.set_index('DateTime')['Rate_'].plot()
This will plot the currency rates over time:
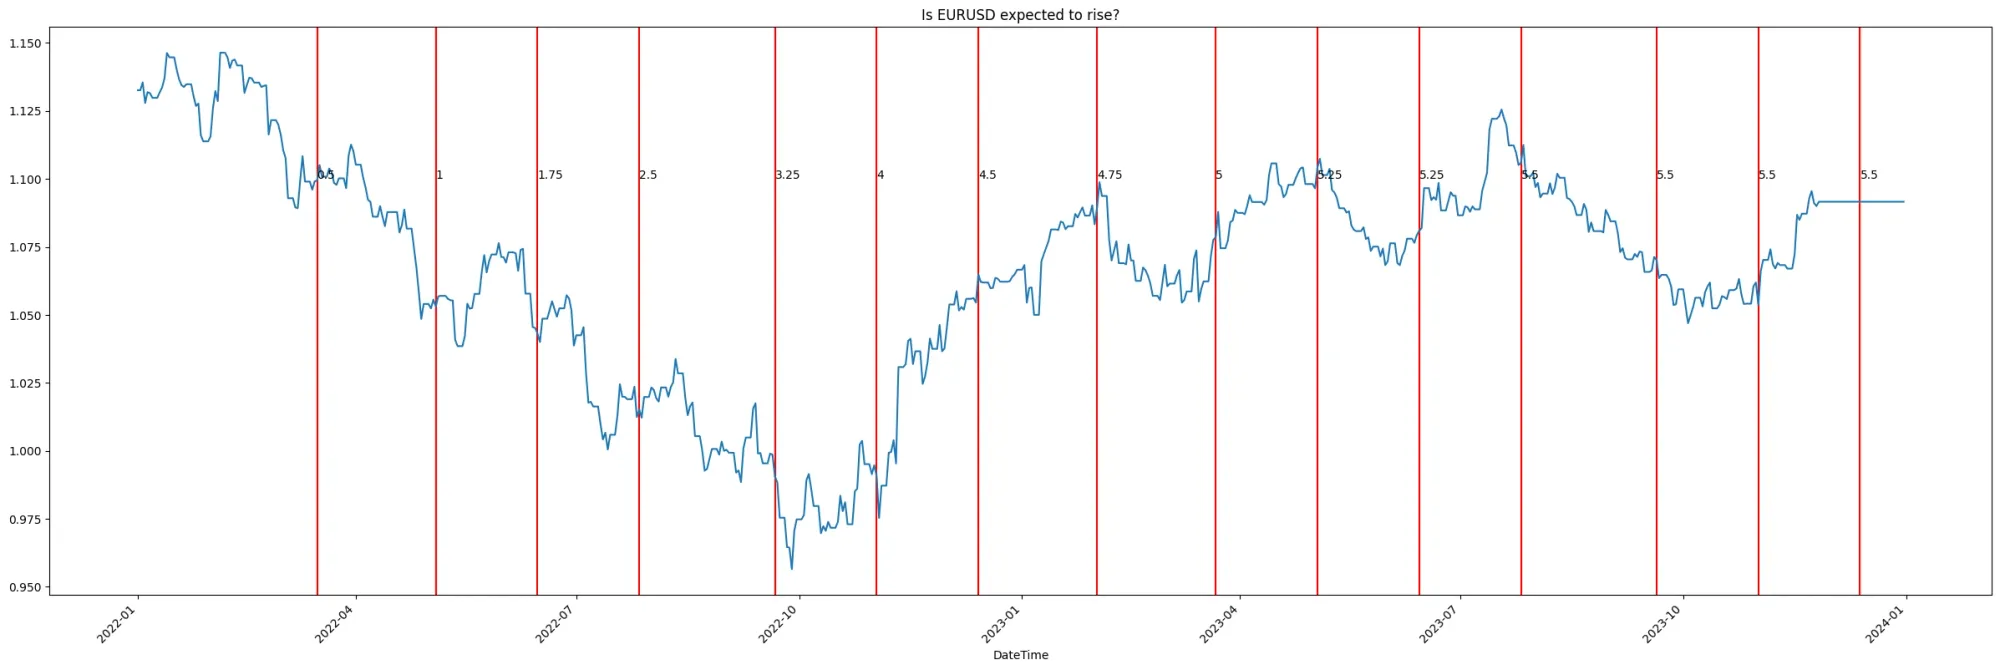
Plot Currency Data vs Dates in Python
If you have a list of dates - for example rate hikes from FED
| Date | Rate | |
|---|---|---|
| 0 | 2024-12-18 | TBD |
| 1 | 2024-11-07 | TBD |
| 2 | 2024-09-18 | TBD |
| 3 | 2024-07-31 | TBD |
| 4 | 2024-06-12 | TBD |
- we can plot them in Python by:
import matplotlib.pyplot as plt
plt.figure(figsize=(30,10))
fig,ax = plt.subplots()

df_fed['Date'] = pd.to_datetime(df_fed['Date'])

df_2023 = df_fed[(df_fed['Date'] > pd.to_datetime('01/01/2022')) & (df_fed['Date'] < pd.to_datetime('01/01/2024'))]

xposition = df_2023['Date']
for i, xc in enumerate(xposition):
    ax.axvline(x=xc, color='r', linestyle='solid')
    plt.text(xc,1.1,df_2023['Rate'].iloc[i],rotation=0)
df.set_index('DateTime')['Rate_'].plot(rot=45, figsize=(30,10))
You can find the result below: