


In this brief tutorial, we'll see how to map numerical data into categories or bins in Pandas. The process is known also as binning or grouping by data into Categorical.
Typical use case for this operations are:
- financial data
- salaries
- years
- ages
- percentage
We will cover several most interesting examples. To start, create a simple DataFrame with percentage, age, salary columns:
data = {'productivity': [80, 20, 60, 30, 50, 55, 95],
        'salary': [3500, 1500, 2000, 1000, 2000, 1500, 4000],
        'age': [25, 30, 40, 35, 20, 40, 22]}
data_ix = ['Tim', 'Jim', 'Kim', 'Bim', 'Dim', 'Sim', 'Lim']
df_example = pd.DataFrame(data, index=data_ix)
print(df_example.to_markdown())
data:
| productivity | salary | age | |
|---|---|---|---|
| Tim | 80 | 3500 | 25 |
| Jim | 20 | 1500 | 30 |
| Kim | 60 | 2000 | 40 |
| Bim | 30 | 1000 | 35 |
| Dim | 50 | 2000 | 20 |
| Sim | 55 | 1500 | 40 |
| Lim | 95 | 4000 | 22 |
Step 1: Map percentage into bins with Pandas cut
Let's start with simple example of mapping numerical data/percentage into categories for each person above. First we need to define the bins or the categories. In this example we will use:
bins = [0, 20, 50, 75, 100]
Next we will map the productivity column to each bin by:
bins = [0, 20, 50, 75, 100]
df_example['binned'] = pd.cut(df_example['productivity'], bins)
the result is:
| binned | |
|---|---|
| Tim | (75, 100] |
| Jim | (0, 20] |
| Kim | (50, 75] |
| Bim | (20, 50] |
| Dim | (20, 50] |
| Sim | (50, 75] |
| Lim | (75, 100] |
Now we can do value_counts:
| binned | |
|---|---|
| (75, 100] | 2 |
| (50, 75] | 2 |
| (20, 50] | 2 |
| (0, 20] | 1 |
Note: If we are interested in the cumulative sum per group then this article is very useful: Python cumulative sum per group with Pandas
Step 2: Map numeric column into categories with Pandas cut
Now let's group by and map each person into different categories based on number and add new label (their experience/age in the area). Again we need to define the limits of the categories before the mapping. But this we need to have also names for each category:
bins = [15, 20, 25, 50]
category = ['junior', 'mid', 'senior']
Let see how to map each employee in one of these categories:
bins = [15, 20, 25, 50]
category = ['junior', 'mid', 'senior']
df_example['experience'] = pd.cut(df_example['age'], bins, labels=category)
result:
| experience | |
|---|---|
| Tim | mid |
| Jim | senior |
| Kim | senior |
| Bim | senior |
| Dim | junior |
| Sim | senior |
| Lim | mid |
Note 1: that bin labels must be one fewer than the number of bin edges otherwise error is raised:
ValueError: Bin labels must be one fewer than the number of bin edges
Note 2: method cut will create Categorical column
Note 3: np.inf can be used as upper limit
Note 4: ValueError: bins must increase monotonically is error shown if the beans are inconsistent
Step 3: Pandas map numeric column with dictionary
Finally let see how to map existing column to a dictionary and map each value:
salary_dict = {1000: 'L1', 1500: 'L2', 2000: 'L3',  2500: 'L4',
               2500: 'L5',   3500: 'L6',  4000: 'L7' }
df_example['salary'].map(salary_dict)
The final result is:
| salary | |
|---|---|
| Tim | L6 |
| Jim | L2 |
| Kim | L3 |
| Bim | L1 |
| Dim | L3 |
| Sim | L2 |
| Lim | L7 |
Note: Non-Exhaustive Mapping can be handled by:
salary_dict = {1000: 'L1', 1500: 'L2', 2000: 'L3',  2500: 'L4'}
df_example['salary'].map(di).fillna(df_example['salary'])
so instead of NaN values the output contains data from the original column(which doesn't have map):
| salary | |
|---|---|
| Tim | 3500 |
| Jim | L2 |
| Kim | L3 |
| Bim | L1 |
| Dim | L3 |
| Sim | L2 |
| Lim | 4000 |
Step 4: Pandas map numeric column with np.select
Finally let's see how to map the values based on selection. The selection is done by: np.select. We are going to divide the salaries into two groups:
- low - 0, 2000
- high - 2000, 4000
This is the code:
import numpy as np
criteria = [df_example['salary'].between(0, 2000), df_example['salary'].between(2000, 4000)]
values = ['low', 'high']

np.select(criteria, values, 0)
and the output is:
['high' 'low' 'low' 'low' 'low' 'low' 'high']
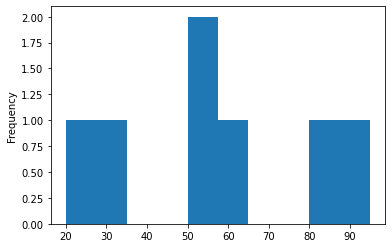
Step 5: Plotting Categorical data
If you need to plot the data for the productivity then you can do:
df_example['productivity'].plot(kind='hist')
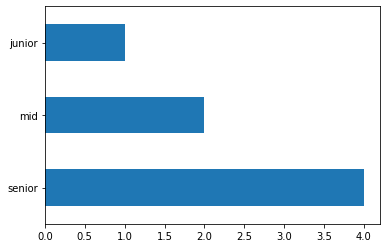
if you like to plot the mapped bins than you can do:
bins = [15, 20, 25, 50]
category = ['junior', 'mid', 'senior']
df_example['experience'] = pd.cut(df_example['age'], bins, labels=category)
df_example['experience'].value_counts().plot(kind='barh')